Screener Update

We have several new features for our current screener and a new screener to announce today.

Trend Explorer Chart

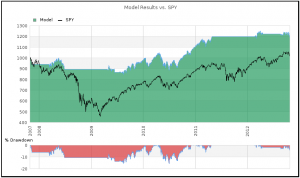
Chart from new Trend Explorer

We’ll start with the boring things such as new features. Few topics are more boring than statistics, so our first new feature is a volaitlity measure, or standard deviation to be precise.  These fields were actually added to the screener a few weeks ago, and a few of you have already found them under the new Volatility section of the drop-down menus.  These fields will carry the Continue reading

Intro to Trend Explorer

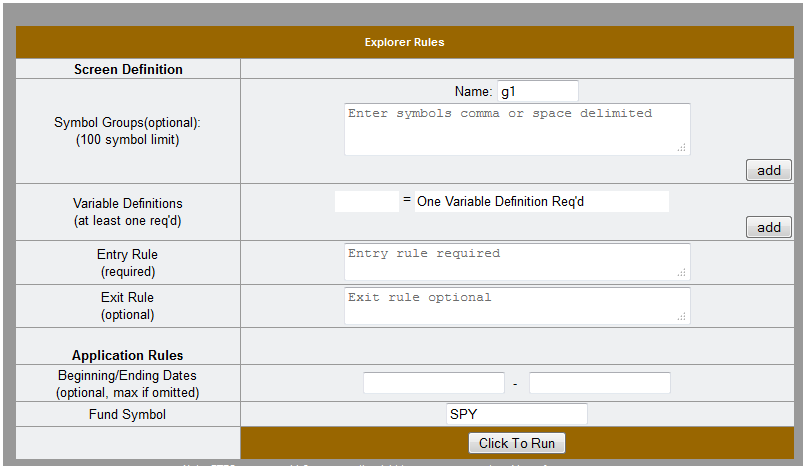
With this post we are excited to introduce our Trend Explorer screening model.  This specialized set of tools is designed for the exploration of the macro trends that often indicate market direction. With it, you can target specific values from our database for specific funds, or you can take a broader view by averaging or counting values across a group of funds.  Based on those values, you can define entry and exit rules for the ETF of your choice and test back to 2002.  (Note: The default is a 5-year backtest utilizing SPY as the trade vehicle.  Premium Access is required for extended functionality – and is now available for Free for a limited time.)

Trend Explorer Form Continue reading

Proposed Screener Changes

To the point:  We are proposing to eliminate infrequently traded funds from the screener. By this we mean those funds that trade less than 8 or 9 days out of 10 over the past 3 months or so.  Exact rules are yet to be determined.

Why:  There are numerous reasons for this.  First, those funds aren’t going to be touched Continue reading

Historical Data Now Available

We are pleased to announce that today we are releasing two capabilities to view historical data on the site.  First is historical trade data behind the screen results.  This was previewed in a post a couple of weeks ago titled More on a Rolling Starts Backtest.

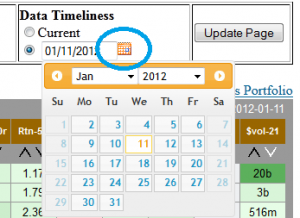
Additionally, we are releasing the capability to view any Portfolio or Screen at a date in the past.  Anywhere you see a calendar calendarlike the one to the right, just click it and select a date.  This image is from a portfolio, but the calendar is also on all screen picks pages just above the data table.  Soon it will be making its way onto other data tables throughout the site.  So, if you’ve ever wondered what a screen looked like just before the latest correction, now you can find out.  We are kicking this feature off with a year’s worth of historical data, but that, too, will be supplemented in the near future. Continue reading

More on a Rolling Starts Backtest

As you hopefully know, the results given for screen backtests represent averages from a series of independent cycles through the data.  A model with a 5-day hold will have 5 independent series of trades and, likewise, a model with a 21 day hold will have 21 independent series that are averaged together to calculate a backtest’s final stats.  The advantage of this methodology is that it utilizes all the available data rather than a small fraction which many backtesting methodologies base their results on.

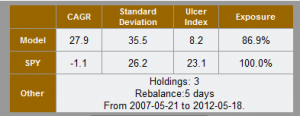
This article will take a more in-depth look at the numbers behind the averages.  For this I chose a published screen by ‘inconversable’ titled CDGR – Amer. C. F. Mk 5.  This screen holds 3 positions and rebalances every 5 days.  As you can see from this image, the CAGR results are shown as 27.9% versus -1.1% for the SPY.

Continue reading

A Look Back at 2011

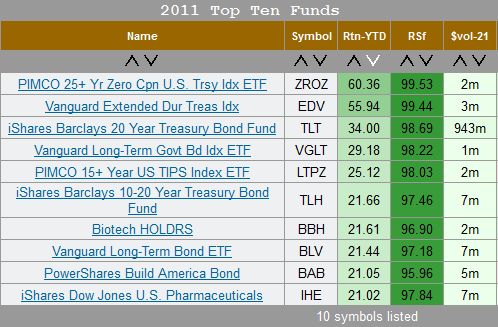
As the year comes to an end it’s a good time to look back and evaluate the performance of various groups of funds. We’ll start with the top 10 performing funds (active and non-leveraged) of the year. As you can see from this table, 2011 belonged to the bond funds. The only equity funds on the list are pharmaceutical funds at positions 7 and 10, and one look at their 1 year charts is enough to give you a good case of heartburn. Continue reading

When the Defense Leads

Last week I noticed a change in the Top Fund Groups table on the Home Page -  Healthcare, Consumer Discretionary, and Consumer Staples groups were all among the top 5 shown.  These industries are not normal leaders during a healthy market,  in fact Healthcare and Consumer Staples are among the defensive industries.  The obvious missing sector is Utilities, and as I write this it is in the number 6 slot and making a dash for the top five.  This new look to the Top Five raised the question – How has the market performed when these industries lead?

Since this is an ETF site I wanted to look at it from that perspective, but ETF history is short.  For this reason I decided to pick a Select Sector SPDR for each industry and compare relative RSf to future performance of the market (SPY).  The three SPDR funds chosen were Consumer Discretionary(XLY), Consumer Staples(XLP), and Healthcare(XLV).  The test period covered the 10 year span from the beginning of 2001 through end of 2010.  This includes two bear markets, two recoveries, and the intermediate period.

Sector Performance

Annualized Returns during Lead/Lag period.

The first test run was between Consumer Staples and Consumer Discretionary.  This didn’t produce any results to get excited about, but things got more interesting when the RSf of these three sectors were compared to the RSf of SPY.  As you can see in the chart to the right, the market Continue reading

New Screener’s Debut

Well, it may not really be it’s debut since a good number of you have been using it for the past week, but The New Screener is now the default screener, the one you get to by clicking ‘Screener’ on the menu bar.  There will probably be a few more problems found, given that one was found this morning, but I expect they will be minor.

If you have links saved to either of the two screeners they should still work.   At some point the older version of the screener will be discontinued but we will give people plenty of time to transition over before that happens.  We’re in no hurry.

Have  a nice weekend, and if you see something that’s not working right, or just needs to be changed, let us know.

Cross Overs/Unders Supported

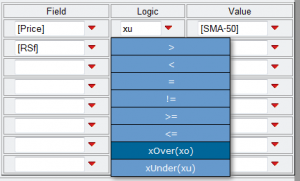
Support for cross-overs and cross-unders has been added to the new screener.  You can see from this image that a cross-over or cross-under is selected from the drop-down menu as easily as any other logic option.   The cross-under in the case shown is selecting those funds where today the price is below the 50-day SMA, but yesterday the price closed above.  They only ‘select’ on the actual day of the cross, so this is distinctly different from filtering for price > or <  and SMA.

But don’t just think about price and moving averages with crossovers.  This could just as well be used to flag symbols where RSI-2 just crossed Continue reading