As you hopefully know, the results given for screen backtests represent averages from a series of independent cycles through the data. A model with a 5-day hold will have 5 independent series of trades and, likewise, a model with a 21 day hold will have 21 independent series that are averaged together to calculate a backtest’s final stats. The advantage of this methodology is that it utilizes all the available data rather than a small fraction which many backtesting methodologies base their results on.
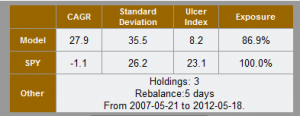
This article will take a more in-depth look at the numbers behind the averages. For this I chose a published screen by ‘inconversable’ titled CDGR – Amer. C. F. Mk 5.  This screen holds 3 positions and rebalances every 5 days. As you can see from this image, the CAGR results are shown as 27.9% versus -1.1% for the SPY.
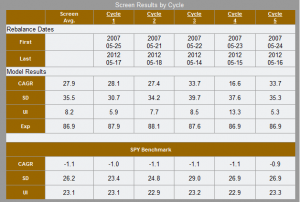
So what is behind this number? Actually, there are 5 independent backtests behind these results. Those 5 backtests start on 5 consecutive days beginning on 5/21/2007, and all end on 5/18/2012. Did they all produce the exact same statistics? Of course not. There is a large amount of random noise in security prices so it is not unusual for these independent cycles to result in wildly different results. The table below illustrates the 5 different cycles for this model.
 The top couple of lines of this table show the first and last rebalance dates for each cycle. You can see these are on 5 consecutive dates but might note that cycle 1 appears out of order. This means nothing for these results; but, these tables will become more commonplace on the site, and the cycles are defined so cycle 1 on a 5 day model is always the same cycle. That way, if you are following a model you can pick a cycle number and have real results to compare against.
Let’s refocus on the numbers, particularly on the CAGR line. You can see that these cycles ranged from a 16% CAGR all the way up to 33%. If you had studied backtest results based on a single cycle, you could have seen any of these numbers and possibly made an incorrect decision about the screen. Backtests are rarely a perfect indicator of future results, but backtests that utilize as much data as possible statistically improve the odds.
Similar variances exist in the other statistics as well. In fact, if you look at the SPY results you will see a small variation there caused by the different starting dates. Depending on market dynamics, there have been a few times that SPY returns were significantly different for models of different holding periods measured over the same time period. Although rare, it has caused a few of you to rightfully question the numbers.
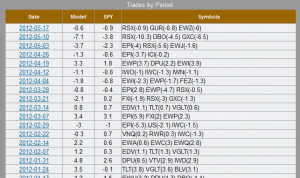
Going a step further, we can look at any cycle for actual trade-by-trade results  grouped by date. The table to the left shows the last few trades for cycle 1 of the screen above.
We are in the final stages of testing before releasing these pages for your usage. We have several other enhancements on deck as well. To support these features it took a good bit of investment in our backtesting server/software, and there is a lot more data to pass around. We are confident you will find this increased documentation valuable and supportive of your decision making.

This will be a great set of enhancement, thanks. Are we also going to be able to have a daily rebalance option? This would make it a bit easier to compare models since there would be no variation due to different starting dates. I have been trading a model based on daily rebalance. I pull up the model about 30 min before the market closes and place “MOC” (market on close) orders.
Thanks for the great site.
Bob
Hugh, Great can’t wait for the trade by trade results.
Thanks for the great resource.
Jorge
How does holding these for 30 days effect the results?
I like the concept and use something similar but also rely on relative strength over a 30 days with nice results.
IS the cycle 5 be made to be Friday etc or is it based on 5 market days and the cycle will keep shifting based on holidays etc?
The cycles are all based on x market days, so a 5 day rebalance will shift days on each market holiday. Let me emphasize that the results we first report are for 5 cycles with 5 day holding periods. From there you have the option, if logged in, to view each of those 5 cycles’ results, and even the individual trade results for each trade, each period. Thanks for the question – Hugh
I was hoping that the cycle 5 was always Friday so the varition in the cycle returns is a calander anamoly that could be expoited, but it looks like it is just the variation in the results of the system , larger variation means more unstable system etc.
Thanks for a quick response.
Huprikar
>larger variation means more unstable system etc.
Unfortunately yes. In a stable system the various cycles should yield similar results. – Hugh
Any chance of getting a daily rebalance option in the future?
Daily rebalance should be included in the next round of releases. – Hugh
That’s great … thanks. Here are a couple of other possible enhancements (1) win percentage, (2) average % gain when a win, (3) average % loss when a loss, and (4) median trade duration.
Why would the backtest results show a model portfolio with a significantly higher terminal value than the benchmark (SPY) but also a significantly lower CAGR?
Sean,
The numerical statistics are the average of all start dates, where the graph shown is for the median (aka typical) cycle. These are usually not significantly different, but in some situations can be. Not knowing the model you are looking at it is hard to say for sure, but I would assume this is the reason for the differences you note. – Hugh