Percentile Rank and Value Functions

Earlier this year for our Premium Access Users we introduced the PREVAL function, or Previous Value function, which made it possible to access prior period’s data.  Whether it was screening for funds which had a rising Moving Average or comparing returns from a past low, this function has found widespread use.

Today for our Premium Users we are happy to add the pRANK function for Percentile Ranks and the VALUE function for determining a field value for a specified symbol.  These two functions add tremendous power to our screening and backtesting capabilities, and we will demonstrate samples of their use below.  Continue reading

A few site tweaks

We made a few tweaks to the site this afternoon, particularly the Alerts page and the Screener page.

We modified the Alerts code to include our EMA options along with the existing SMA’s, price, and RSf.  This was a request we received subsequent to one of our prior blog posts, so please don’t think we totally ignore you.  We may be slow at times, but we do listen.  Continue reading

New Screener Features

This post introduces three new features for the screener:

  1. Hold Thru Rank Option
  2. Access to Previous Values
  3. Improved Error Detection

Hold Thru Rank is the ability to not sell a position in a backtest until it drops below a given screen rank.  For example, let’s say you develop a model to hold 3 positions. Continue reading

Monthly Seasonality and ETFs

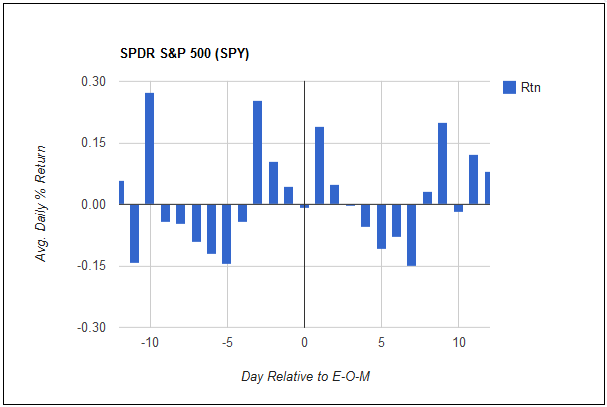
The month-end effect is well known by many market participants but often not fully understood.  I recently read an academic paper that piqued my interest enough to study the subject myself.  Ironically, because I would have liked the author of that paper to have looked at the subject differently.  Some of you may be familiar with Mebane Faber’s blog The Idea Farm. SPYseasonalIf not, I highly recommend it for trading ideas.  It’s not a traditional blog; however, he emails one or two research reports from first rate sources each week.  His January 23rd email offered a Deutsche Bank paper that was itself a review of recent academic work.  One of the papers reviewed Continue reading

Premium Access Arrives

Our Premium Access service has been mentioned several times the past few months. During that time you have had the opportunity to try out many of the features, and many of you signed up for the free trial period. As yesterday’s email to those individuals stated, that period ends tonight. Tomorrow most of the complimentary subscriptions expire, and you will need to subscribe to continue with your Premium Access level of service. Continue reading

The Search for a Bond Screen

With Washington polarized and the fiscal cliff approaching it is no surpriseHazard the market is a bit shaky.  This week the politicians gave us a Thanksgiving gift by showing an appearance of unity and then leaving town, but what will happen when they return?  Do we trust that all the hostilities of the past are mended and that the same politicians that have not been able to agree on anything the past few years will now be willing to compromise?  Doubtful, at least in the short term.  Maybe, in the eleventh hour, but that is a long month away. Continue reading

Screener Update

We have several new features for our current screener and a new screener to announce today.

Trend Explorer Chart

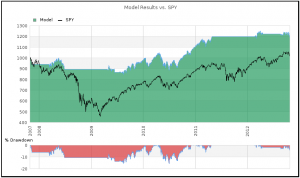
Chart from new Trend Explorer

We’ll start with the boring things such as new features. Few topics are more boring than statistics, so our first new feature is a volaitlity measure, or standard deviation to be precise.  These fields were actually added to the screener a few weeks ago, and a few of you have already found them under the new Volatility section of the drop-down menus.  These fields will carry the Continue reading

Intro to Trend Explorer

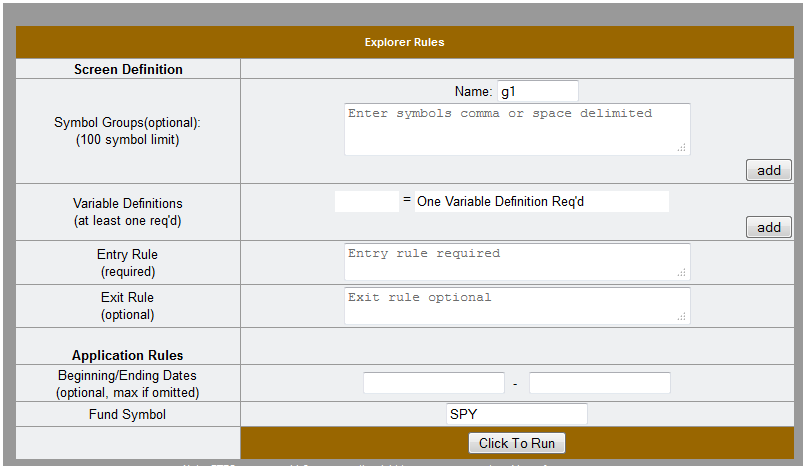
With this post we are excited to introduce our Trend Explorer screening model.  This specialized set of tools is designed for the exploration of the macro trends that often indicate market direction. With it, you can target specific values from our database for specific funds, or you can take a broader view by averaging or counting values across a group of funds.  Based on those values, you can define entry and exit rules for the ETF of your choice and test back to 2002.  (Note: The default is a 5-year backtest utilizing SPY as the trade vehicle.  Premium Access is required for extended functionality – and is now available for Free for a limited time.)

Trend Explorer Form Continue reading

Proposed Screener Changes

To the point:  We are proposing to eliminate infrequently traded funds from the screener. By this we mean those funds that trade less than 8 or 9 days out of 10 over the past 3 months or so.  Exact rules are yet to be determined.

Why:  There are numerous reasons for this.  First, those funds aren’t going to be touched Continue reading

Historical Data Now Available

We are pleased to announce that today we are releasing two capabilities to view historical data on the site.  First is historical trade data behind the screen results.  This was previewed in a post a couple of weeks ago titled More on a Rolling Starts Backtest.

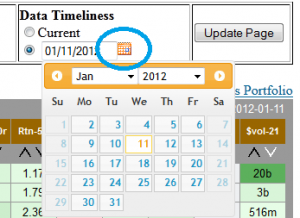
Additionally, we are releasing the capability to view any Portfolio or Screen at a date in the past.  Anywhere you see a calendar calendarlike the one to the right, just click it and select a date.  This image is from a portfolio, but the calendar is also on all screen picks pages just above the data table.  Soon it will be making its way onto other data tables throughout the site.  So, if you’ve ever wondered what a screen looked like just before the latest correction, now you can find out.  We are kicking this feature off with a year’s worth of historical data, but that, too, will be supplemented in the near future. Continue reading