
 We will soon be introducing the ability to customize the technical indicators used on the site. This means you will be able to define moving averages of any duration or screen on your favorite 8-month total return (which we don’t currently support, but some people prefer). We will also be adding new indicators that we don’t already include.
Today we are making some foundational changes that we will build on over the coming weeks. For the most part, you should not notice these changes, but we want to make you aware and open the door for communication if you experience any issues.
There are, however, three changes you will likely notice and need to be aware of. The most significant change is the addition of a new screening field actPrice, or the actual unadjusted price. Historically, the Price field has been an unadjusted price that could be used for testing actual price, such as [Price] > 10, or against a moving average, such as [Price] > [SMA-100]. Additionally, with some “magic” behind the scenes, it could be accurately used to test against a historical value such as [Price] > PreVal( [SMA-50], 10), which compares today’s price to the 50-day SMA from 10 days prior.
Adding the flexibility to define custom indicators, which will use prices adjusted for splits and dividends, means a distinction needs be be drawn between the current adjusted price and the current un-adjusted price. To that end, we will support [Price], which is adjusted, and [actPrice] which is not adjusted. Since all data on the site is (or will be) adjusted for splits and dividends, the major purpose of the [actPrice] field is to compare to a dollar value such as [actPrice] > 10.
At this point both values are the same, but we suggest you use them as noted above since existing screens will be changed over the next few days, and it will no longer be valid to compare [Price] to a dollar value in a backtest.
The second item to note is a change in the screener field menus to support the new field. With the addition of the [actPrice] field we have combined the Price with the Volume fields into a new Price and Volume related section. Nothing major here, just be aware of why it has changed.
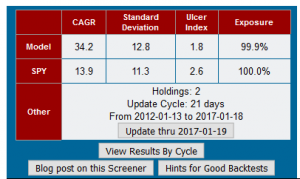
Note the “Update” button within the stats table.
The third item has to do with screen update functionality. We are moving the update time to 5:00pm ET as part of the end-of-day update rountine we perform then. This means you can update your favorite screen in the evening rather than waiting until the next morning – something we know a few of you would like to do.
As part of this change, screens that have been run recently but are not up-to-date will need to be rerun manually by clicking an update button inside the stats box. This is an extra step if you are wanting the updated stats, but saves a lot of time if you are researching screen results and don’t mind looking at a 2-day old backtest. If you find a screen you are interested in and want the updated results then just click the update button. It’s easy.
There are a lot of changes behind the scenes that we won’t address, but please be aware, and let us know if you suspect an issue. Next week we should begin rolling out the indicator customizations beginning with Rate of Change (ROC) and moving averages (SMA and EMA). If you are curious why ROC, it can be used with the [Price] field to calculate trailing returns.
Please let us know what new indicators you would like to see included.
I sent a note earlier but I am only able to run 5 year backtests on my favorite screens.
Thanks for posting here because I somehow missed the earlier note. I’ve confirmed the problem and we’ll look into it. Sorry for the inconvenience.
This issue has now been fixed and backtests longer than the 5-year default should run. I apologize again for any inconvenience caused by this issue. Thanks for the feedback and have a great weekend. – Hugh
The start date is currently reverting to the five-year period for people with Premium Access even though the requested start date is for periods longer than five years.
This hiccup just began in the last day or two.
TIA
Thanks for the feedback. This issue has now been fixed and backtests longer than the 5-year default should run. I apologize for any inconvenience this has caused. Have a great weekend. – Hugh
Are you considering adding additional moving average indicators … or possibly a user defined moving average? For example, 75 day or 150 day moving averages.
We will be adding user defined moving averages. They should have already been rolled out but we’ve been distracted by the conflict between ad blocking software and our drop down menus. The moving average code just needs a touch more testing and it should be ready to go. Thanks for the question.
hello
do you know when (more or less) you will add more indicators?
I am eagerly wating Slow stochastics and Williams Percent.
Meanwhile, do you know of a site in which you can input a list of stocks and the site return a list of values of one chosen indicator?
example: you input RSI(14) QQQ,MSFT,AAPL,IWO,MMM and the page return a list of the RSI(14) of each of those stocks.
David, thanks for the feedback. We are currently working to add a full library of indicators to the site. This has been slow coming due to performance issues with our first attempts. This one is looking good so far, but I should know more next week.
Unfortunately I do not know of a site that will do what you are looking for, but you might look at stockcharts.com. I would think they might have something. Maybe build a portfolio and then select to screen on RSI(14)?
Thanks.
Is the PreVal( [SMA-50], 10) function available in trend explorer?
At this point PreVal is not supported in Trend Explorer. We’ll look at the feasibility of adding it. Thanks for the suggestion. — Hugh