We are pleased to announce that today we are releasing two capabilities to view historical data on the site. First is historical trade data behind the screen results. This was previewed in a post a couple of weeks ago titled More on a Rolling Starts Backtest.
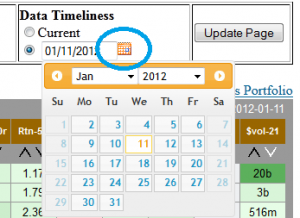
Additionally, we are releasing the capability to view any Portfolio or Screen at a date in the past. Anywhere you see a calendar  like the one to the right, just click it and select a date. This image is from a portfolio, but the calendar is also on all screen picks pages just above the data table. Soon it will be making its way onto other data tables throughout the site. So, if you’ve ever wondered what a screen looked like just before the latest correction, now you can find out. We are kicking this feature off with a year’s worth of historical data, but that, too, will be supplemented in the near future.
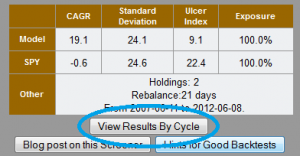
As was mentioned above, we are also making trade data available to supplement backtest results. A new button will now appear near the bottom of the backtest statistics box titled View Results By Cycle.  This button will lead to the first of two new pages, this one showing results for each cycle. On that page you can see how the backtest results vary with start date. Some screens are fairly consistent, and some appear almost random. Click the cycle number in the table header, and you will go to that cycle’s page which includes a performance chart, some relative statistics, and period by period trade data. These features were mostly covered in the More on a Rolling Starts Backtest post, so you can see it there, or just check out your favorite backtest.  Many of you have asked for this data for a while, and we are glad to be able to make it available.
These two new features are currently available for anyone who is registered on the site and logged in. They are part of a package of features that will be available by a small subscription fee starting in a few weeks. Since these features are ready and have been in heavy demand, we wanted to let our current users have access while the remainder of the package is assembled. Enjoy!

I tried to post a few days ago, but it does not seem to have worked.
These improvements are great. Thank you very much for this quality tool!
Don’t know what happened to your post a few day ago, but thanks for the comments tonight. Feedback is appreciated and suggestions are welcome.
Thanks for all the facilities you provide on this site
I love the ETF screener
If you can add the ability to show in the backtest result, the picks from each cycle in the past and the return from that corresponding period (similar to backtest.org of the MI side), and extend the ability further into the past, that would make it perfect
again, THANKS
Henry
Henry,
Thanks. If you register and log in you will see a link below the summary statistics that will take you to results by period, and on that page click a cycle number and you will see funds selected and return data. – Hugh
THANKS
I found it –
It’s a fantastic tool for me
Henry
Arethe transation prices that days closing or next day open?
Transaction prices are that day’s closing prices.
Just keeps getting better. Any chance the backtest period could be extended beyond a rolling five years? More is always better, plus, it will be a shame when the crash of 2008 passes out of sight. The “international” and “sector” strategies show data back to 2001. It would be great to have those years in the screener.
Not a technical person, so I admit, I literally don’t know what I’m suggesting.
A long-time fan,
Baltassar
Baltassar,
Thanks for the feedback. We’ll probably start with 2001 or 2002, not much reason to go earlier. At the beginning of 2001 there were only 94 or so ETFs, but that’s better than the 32 that were trading a year earlier. Also, 2001 is one of those good years to include because it throws a few different curves at a model. – Hugh
Completely agree that there’s no reason to go back further than 2001, But the 94 ETFs that existed then do allow the creation of pretty diversified portfolios, perhaps not identical to ones you would create today, but conceptually similar.
Anyway, it would be a great addition if you can manage it. Apart from everything else, it will allow people who have optimized methods for the last five years to see how they would have worked “out of sample”. Always interesting 🙂
Baltassar