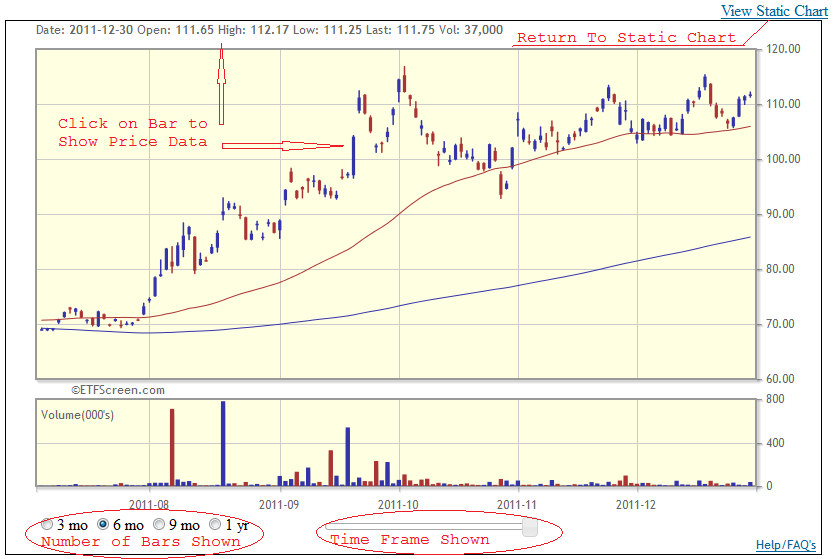
We are excited to be introducing a new interactive charting package for the New Year. For a while now we’ve been searching for new charting tools and finally found an interactive charting package we think fits the site. Our goals were modest. We wanted to be able to scroll through time and we wanted to be able to click on a bar and view the price data.  We also like cross-hair scroll bars to compare highs and lows, and we would like to be able to customize moving averages and show other data series besides price and volume. The implementation being offered today falls short of the last two goals, but offers the others and can be easily enhanced with additional features.
Every package we reviewed had some limitation that prevented it from being a universal fit for all our users. In the end, we chose an HTML-5 based package that works with all new browsers, but has some limitations with older systems. Unfortunately, this means it does not work natively with IE versions prior to version 9. We have an FAQ Page with some options for those of you that are affected by this. Hopefully most of you will find a viable solution through an upgrade or browser add-on.
The Interactive Chart option is selected from the link at the top right corner of the normal price chart. Once selected your preference will be remembered for the duration of your visit, and you can always return to a static chart by a similar link on the interactive chart. Note there may be a small delay on the first use as the number of browser instructions is quite lengthy.
As always, we need some feedback so we can improve this further. We think it is a great foundation, but are looking to our users to tell us how to tailor it.
Enjoy, and Happy New Year to each of you.
