
We all accept that there are spreads between the bid and ask prices we pay for our securities, but we shouldn’t assume they are all the same, nor that they are all insignificant.
♦ SPY typically trades with a spread of only 0.004%
♦ Top 10 ETFs trade with typical spreads below 0.01%
♦ Some top 1000 ETFs have spreads over 1%
We were recently approached to put some numbers together comparing spreads between micro-cap stocks, small-cap stocks, large-cap stocks, and a select basket of ETFs. Brian Livingston, author or Muscular Portfolios, was preparing an article for Marketwatch and needed real-world statistics to support his work.
Typical End of Day Spreads
| Smallest Micro-caps | 3.26% |
| Smallest Small-caps | 1.12% |
| Smallest S&P 500 | 0.12% |
| Largest S&P 500 | 0.02% |
| ETF Basket | 0.04% |
His findings will not be repeated here because you can see his article on Marketwatch. The table to the right shows how these groups differ even at the end of the day when the market is most liquid and spreads are compressed.
Livingston explores this in detail with an emphasis on the extreme opening spreads and the dangers they present to the careless trader. Regardless of when you trade, if you are trading less liquid securities it is important to be conscious of spreads and to protect your trades and profits as much as possible.
After seeing the variations noted above we wanted to explore spreads among ETFs. The chart below focuses on 1,000 of the most active ETFs out of the 2,189 we currently track on this site. It is clear that while many ETFs trade with reasonable spreads, there are a significant number that do not, and it is important for ETF traders to be just as conscious of spreads as it is stock traders. We often hear it said that the liquidity of the ETF is not important, but what is important is the liquidity of the underlying assets. That may be true, but obviously only so if you are using limit orders.
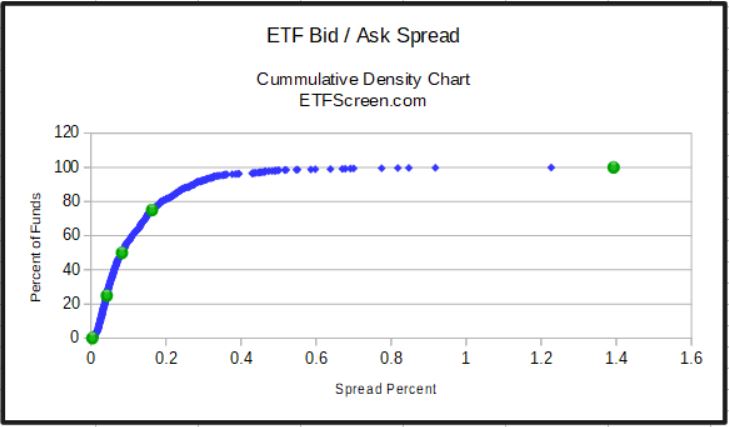 The green dots divide the above distribution into equal quartiles with 250 funds in each of the four segments. The lower-left segment begins with the major funds such as SPY, QQQ, IWM, and GLD. These and others like them trade with spreads below 0.01%, with the first quartile topping out at 0.04%. The second quartile goes up to 0.08% and the third up to 0.16%. That is getting significant, but it is nothing compared to the last quartile where some spreads approach, and even exceed, the 1% mark.
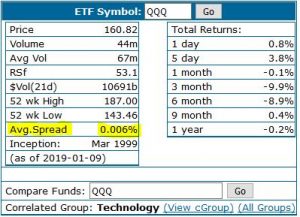
So where can you find spread data? Just pull up a symbol for any of the ETFs we track and look in the stats box just below the chart. The image to the right shows the data for QQQ, but spreads are available for any of the actively traded funds that we track on an intra-day basis.
The fund at the top-right of the above distribution is HSPX, a covered call fund by Mirae Global Assets and marketed under the Global X brand. This fund trades about 1.4 million dollars per day, so not an insignificant amount and better than most of the ETF universe. Obviously, decent liquidity does not mean a decent spread. While there is a general relationship between trade volume and spreads, it is not 100%, and spreads can vary. Also, note that spreads vary significantly during the day, and these numbers are averages across the day from open to close. You can expect them to be higher at the open and lower near the close.
Pay attention, or pay the spread.
The article does not state how to avoid the large spreads. I check the bid and ask numbers to see the spread and also use limit orders when I don’t like what I see.
Thanks for the comment. It’s a common mistake to not check spreads with the assumption that ETFs are different from stocks. The point of the post is to suggest such oversight can be costly. Limit orders are your best option unless there is another fund that will fill the same need in your portfolio. — Hugh