
 TA-Lib is an open source library of over 150 customizable indicators and mathematical functions that we are incorporating into our screening code. This gives you the ability to test new strategies and fine tune your existing ones.
We are currently releasing the library with support limited to nine popular indicators including two moving averages (EMA and SMA) and seven momentum indicators (ADX, AROON, CCI, MACD, PPO, ROC, and RSI). Other indicators will be released over the next few days, but these most popular indicators are ready to go.
The process to include an indicator into your screen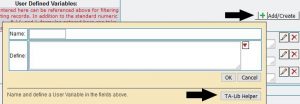 is the same as defining a user variable. Just click on the Add/Create button to open the variable definition box and then click the TA-Lib Helper button in the lower right corner. This action opens some drop-down selectors you can use to locate your indicator of choice and, if appropriate, select an output option.
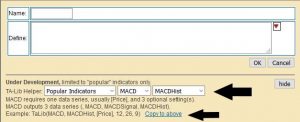
Most indicators like SMA and ROC take a single input series and output a single series. With these you usually input price and output a moving average or rate of change. Other indicators are more complex with multiple inputs and/or multiple outputs. For example, in the last image above the chosen indicator is MACD. Since this indicator outputs three data series (the MACD, the MACD Signal, and the MACD Histogram) the user must select which they want, in this case the MACD Histogram. If the user wants two or more of the outputs they must define a user variable for each since a user variable is limited to a single data series. For most indicators that only output a single series, there is no option for an output series.
While you can type a definition into the Define box it is easier and less error prone to click the “Copy to above” link and let the system copy a default rule to the define box. From there you can customize either the input fields or the various indicator options. For those indicators that utilize price data just enter the [Price] field like the default. This will reference closing data for most indicators, but also make available open, high, low, and volume for indicators that need those fields, like Commodity Channel Index (CCI) and a number of others.
Remember to name your user variable something meaningful and then click OK to save the UV to your screen. After that, you reference the UV just like any other.
It is beyond the scope of this post to define each indicator and the options available, but most are intuitive if you are familiar with the indicator from other systems. There is some information available on the TA-Lib Home Page, but a better source for the indicators is probably at this Python related site.
Below are a few examples of TA-Lib function codes:
TaLib(EMA, [Price], 20) – A 20-day Exponential Moving Average(EMA) of the closing prices.
TaLib(SMA, [RSf], 10) – A 10-day Simple Moving Average(SMA) of RSf. Note you can reference any standard data field, or even another user variable as input.
TaLib(MACD, MACDHist, [Price], 12, 26, 9) – Here an MACD is being defined and you will see is requires more inputs that the simple moving averages shown above. After the indicator (MACD) is specified an output field must be specified, here it is MACDHist for the histogram data. After that there are the three defining inputs required for an MACD. The first two are EMA lengths for calculating two moving averages and the third is used for calculate the signal line. More information on this and other indicators can be found on Investopedia.
TaLib(EMA, [ _EMA1], 5) – An indicator can reference the output of another by referencing the variable name as input. Here, if EMA1 had previously been defined as TaLib(EMA, [Price], 20), then the above would give you the 5-day moving average of the 20-day moving average.
PREVAL([_EMA1], 21) – The PREVAL function can be utilized to reference the value of an indicator some days in the past. In this example we are referencing the value of a variable we named _EMA1, 21 days prior. Utilizing this one can determine whether an indicator is rising or falling over some time period. In testing we’ve used this in a filter rule to determine if OBV values were rising over the past month.
We recognize a few additions that need to be made to the text box describing the indicator, like including the name and describing what each option field does. These tweaks will be made in the near future, but please provide us feedback on other changes that need to occur.
We also need feedback on how to present the Volume based indicator values: AD, ADOSC, and OBV. These indicators are designed for chart reading and the actual numerical values are meaningless. For the purposes of this site, how should this data be presented? We’ve considered moving average relationships, changes in a moving average over time, and even linear regression slope. We’re confident there are better options out there so we’re asking for help. In the meantime these indicators are currently unavailable due to related technical issues.
We’re excited about the possibilities of this new library as it opens many doors for our users to explore. It’s probably obvious, but these customizations are reserved for our Premium Access users.
Enjoy and please provide feedback.
From what I understand the OBV is useful when there is a moving average attached, so that an OBV rising above or moving below a moving average of some sort. Can be useful for trend change detection or reinforcement.
Initially I thought this was nice but not very useful. Then the light bulb went off and I realized I could use the indicators not alone, but in the screens for overbought, oversold, better scans, buy, sell, etc. I also note that I can now replicate the Number One Public Chartlist in Stockcharts (I could but I am trying to do something different). Finally, in regard to OBV/Volume, because it is so visual, perhaps another chart like the 5 day or 21 day “comparison of checked symbols” would be something for you to think about. Similar to RSf, but not relative to other volumes, but only to its own volume over a set amount of time. And one other thing, although I expect you have no control over it…it would be helpful if TA-Lib had VTX…I seem to prefer it over ADX and similar indicators. Thanks for the new indicators.
Thanks for the feedback, much appreciated. This library is far from perfect but does bring significant potential to the table. Congratulations on replicating the Stockcharts scan. The TA-Lib library does not support VTX, but I’ve taken a look at the code and it should not be difficult to add. My goal is to develop an abbreviated library with some in-house indicators along with the popular (sometimes modified) indicators from TA-Lib.
I think we have a plan for the volume indicators, but a few more details to work out.
Do you have an updated list of supported indicators? I’m curious to backtest using KAMA.
The TA-Lib options are all listed in the drop downs. Click to create a User-defined variable and then click TA-Lib Helper. KAMA is an option under the “Overlap Studies” section with other moving average types. — Hugh
Questions about Market Timing Rule
I understand that the market timing rule has not impact with the “current screen picks” displayed. But when the rule is false none of the trades take place to calculate the CAGR and all “cash investment” is invested in the symbol specified.
CAGR seems to be calculated immediately after market closure. However when viewing data right before closing say at 3:59 pm there is often a contradiction between the action to take highlighted in yellow (according “The Market Timing Rule associated with this screen suggestion (…) at this time” and the suggestion after market closure.
What would be the source of this (costly) effect?
I use MTR:VIXM. Maybe this symbol is not updated regularly (every 10 minutes) by ETF Screener?
I use the prevail( ) function within the MTR. Maybe it is updated only once daily after market closure?
Some variables such are [RSI-2] or [APR-1] are not updated regularly every 10 minutes?
Or does it have to do with Ta-Lib ?
Given the fact that market jumps so much at opening and since I cannot wait for market closure to decide to buy or not ETFs or invest the “CASH” I would really appreciate some help.
Thank you.
Good questions, Franodeau,
I’ve been monitoring one of your earlier screens that uses SVXY in the MTR. I try to simulate trades in the last 30 minutes of trade, but often find myself picking up the action after market close. I’ve seen the situation you mention once over the past two months. Obviously the timing difference will catch you periodically as it has both of us.
Your screen is usnig VIXM which often trades less than 50,000 shares a day. That implies there are intervals during the day with no trade activity and prices must catch up with the market when they do trade. That means the indicators will jump.
Since all indicators are recalculated with each price update cycle (5-minutes during the day) they should be correct as of the latest price. I suspect what you are seeing is due to the screen use of VIXM and the general fragility of these screens caused by the large number of variables. That is why I am watching closely before devoting cash.
I’ll try to watch a bit closer, but the screens we are discussing are complex and difficult to to determine what is driving the decisions. Let me know if you have other questions or thoughts.
Hugh