
The month-end effect is well known by many market participants but often not fully understood. I recently read an academic paper that piqued my interest enough to study the subject myself. Ironically, because I would have liked the author of that paper to have looked at the subject differently. Some of you may be familiar with Mebane Faber’s blog The Idea Farm.  If not, I highly recommend it for trading ideas. It’s not a traditional blog; however, he emails one or two research reports from first rate sources each week. His January 23rd email offered a Deutsche Bank paper that was itself a review of recent academic work. One of the papers reviewed was titled A Survey of Day of the Month Effect in World Stock Markets, by Jay Desai and Arti Trivedi which is available at http://ssrn.com/abstract=2171634. They focused on returns by calendar day for several world stock indexes and conclude that all have statistically strong and weak days during the month. They also found that many show the common “turn of the month” effect, which is abnormal strength in the days leading up to and immediately following the month end.
In reviewing this paper I wished they had focused on trading days pre- and post- month end rather than calendar day. With different months having different numbers of days and weekends scattered through, it was hard to see a path from their research to a trading strategy, and a trading strategy is what we want. The concept of monthly seasonality has been studied many times before, and I reviewed a good number of the links that Google offered. The earliest was from 1984 in a paper titled A Monthly Effect in Stock Returns, by Robert A. Ariel. Another more recent paper is Equity Returns at the Turn of the Month by John McConnell and Wei Xu, from 2006. These studies all focused on indexes and were longer term than one can achieve with ETFs, but ETFs provide a convenient vehicle to review recent history.
Since our ETFScreen.com site is based on return data, it was relatively easy to summarize the stats once we developed a proper numbering scheme for the days. We decided to focus our analysis on the trading days from 12 days prior to the last day of the month, to 12 days after the last day of the month. Since the typical month has only 21 trading days, this gives us some overlap at the extremities, so any mid-month anomalies are not terminated prematurely. The chart above shows the data for SPY, which is also tabulated below. Day 0 is the last trade day of the month, and returns are from the prior day’s close. As an example you can see from the data that SPY has been slightly negative on the last trading day of the month during this time period.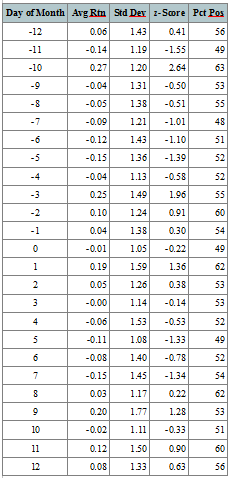
Looking at the chart above, we see that beginning with day -9, there is weakness, followed by strength in days -3 to +2 or +3, and then further weakness. From the base data, I know that SPY has a total return of 36.15% over the 12-year period of 2001-2012. This equates to a CAGR of 2.6%, or about 0.21% per month. If we focus in on the bars from -3 to +2, that is 6 days, we have an average return of 0.62% per month. This implies that over the remaining 16 days SPY has had a net loss of 0.41% per month. Trading only these six select days would have taken that 36% total return up to about 143%, for a CAGR of roughly 7.7%
Yes, I hear you. There are transaction costs and other slippage, and this would not be achievable, and you are potentially right. Judging from the current time period, this strategy is also not without it’s volatility. However, we should be able to improve on the returns by fund selection and possibly some refining of the entry/exit rules with some market indicators. The important take-away from this quick study is that this “turn of the month” seasonality can be significant to our returns and should probably not be ignored.
Let me add that this effect is fairly broad based across market sectors and in many international ETFs. I could list them here, but this link allows you to explore them for yourself. The default symbol is SPY, but to the right of the chart are convenient links to some sector funds and a few international funds. Beyond that, enter whatever ETF symbol you want to explore.
Like I said above, the goal is a trading strategy. I invite comments about where we should go from here and how you would like to see the data presented.
Are you suggesting we use this info for both buy on probable low periods and sell on probable high periods or just one area?
JD – Thanks for question. The point I wanted to make in this post is that there are periods of the month that are significantly weak or strong, including the “turn of the month” period. Some of these periods may not be strong enough to cover the costs of trading in and out, but might be strong enough to be considered when entering or exiting a trade for other reasons. So one way to use this knowledge is as supplemental information. On the other hand, short-term oriented traders may be able to develop a system around these seasonal patterns. I plan to study each of these two methods. For example, what is the best day of the month to trade the monthly momentum based screens? On the shorter term end of the spectrum, how do we screen for what funds should do best during the turn-of-month period? At this point I personally have more questions than answers. – Hugh
As an update – today was the final day of the 6-day turn-of-month period. The past 6 days have been volatile but positive for SPY, QQQ, DIA, and IWM. I will be posting some additional follow-up information, but at this point it appears the upcoming weak period may not be so weak during bull market periods when the price is greater than the common moving averages. This gets back the question JD asked, and the answer might be that “it depends”. – Hugh
Another variant to investigate would be calendar quarter seasonality (last day of March, June, September, December). There always seems to be mention of a quarter-end effect, with money managers moving into strong sectors for window-dressing. One example: buy high-rsf spyder sectors some number of days before end of quarter and sell some number of days after.
Can monthly seasonality be combined with yearly seasonality? Instead of holding DIA, for example, from November through April, one holds it from -3 of November through +2 of May. But one can research monthly seasonality impact on bullish months as against bearish months. This may lead to a year-round trading strategy.
Some months show better results than other for days -3 to +2, so it could be beneficial to report the seasonality results by month. However, if you are talking about a continuous hold from -3 of November through +2 of May, I don’t believe the small adjustment to the beginning and ending dates would be significant. There are tested rules for entering and exiting the “fall to spring” holding period, but I don’t have those studies in front of me at the moment. – Hugh